Taissa A. F. de Sousa
Interaction & Visualization Designer, M.Sc. in Computer Science
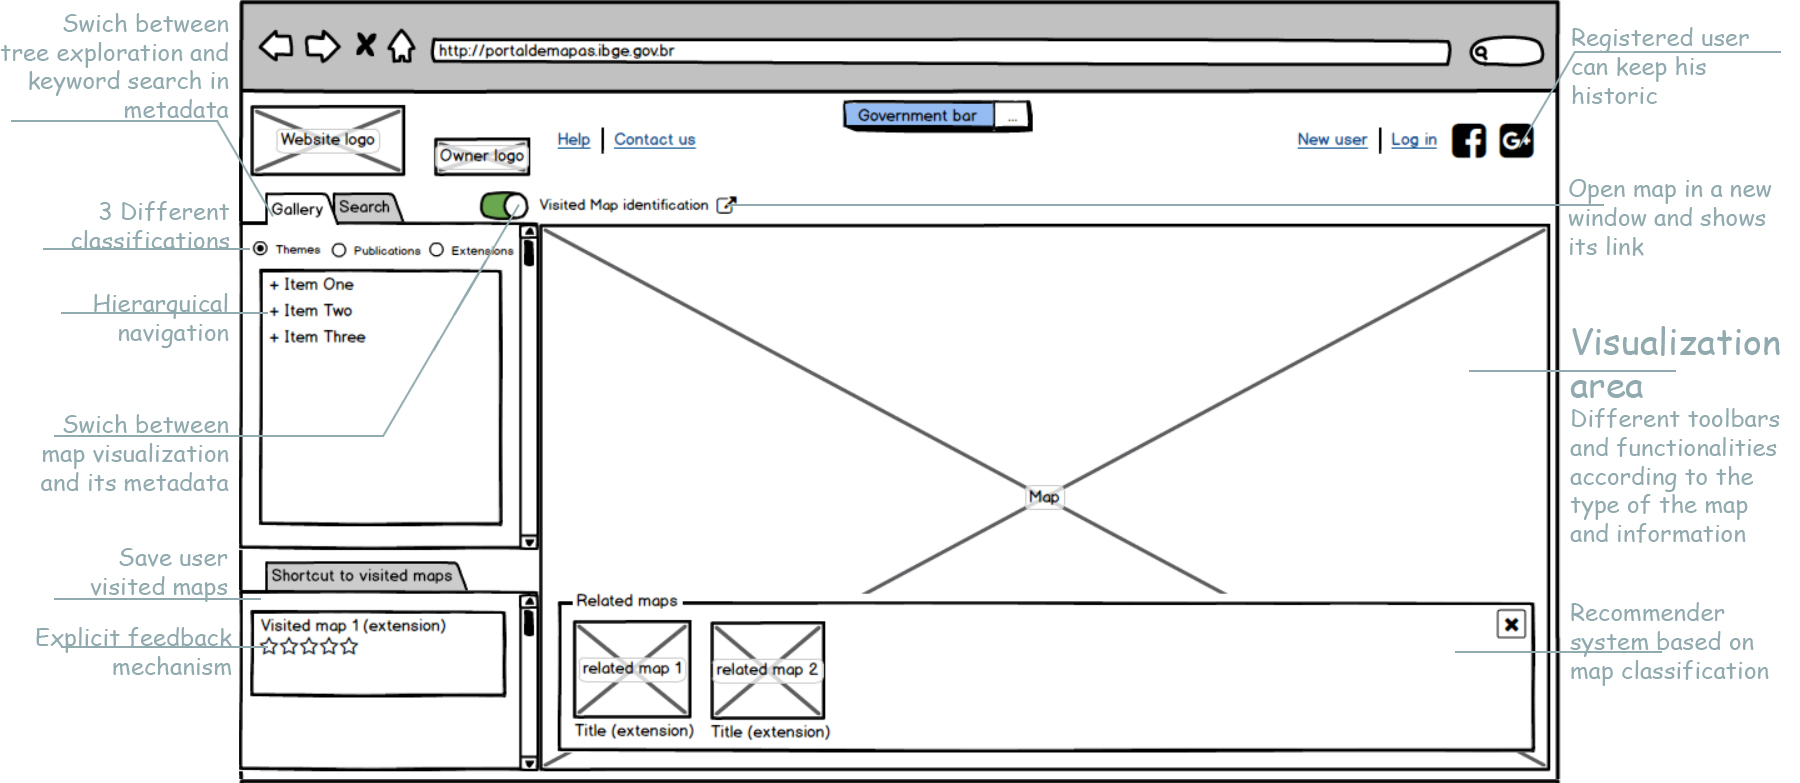
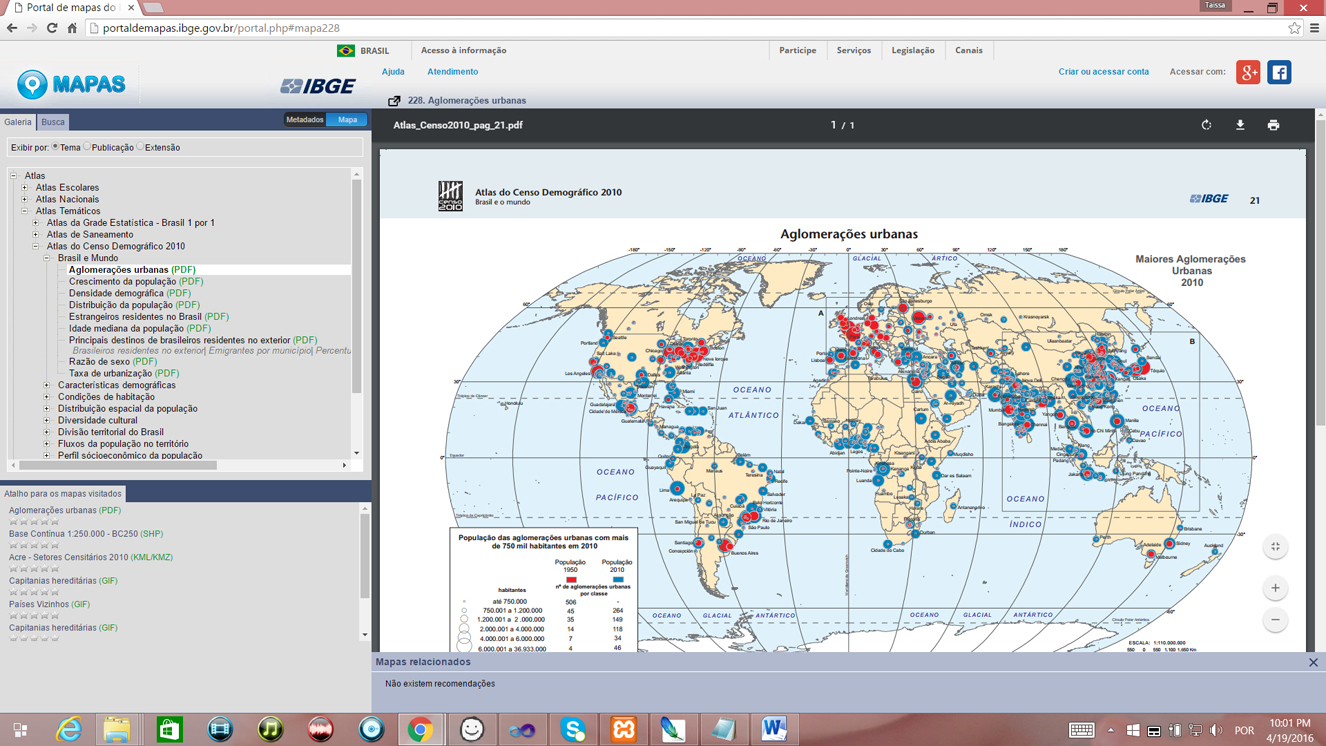
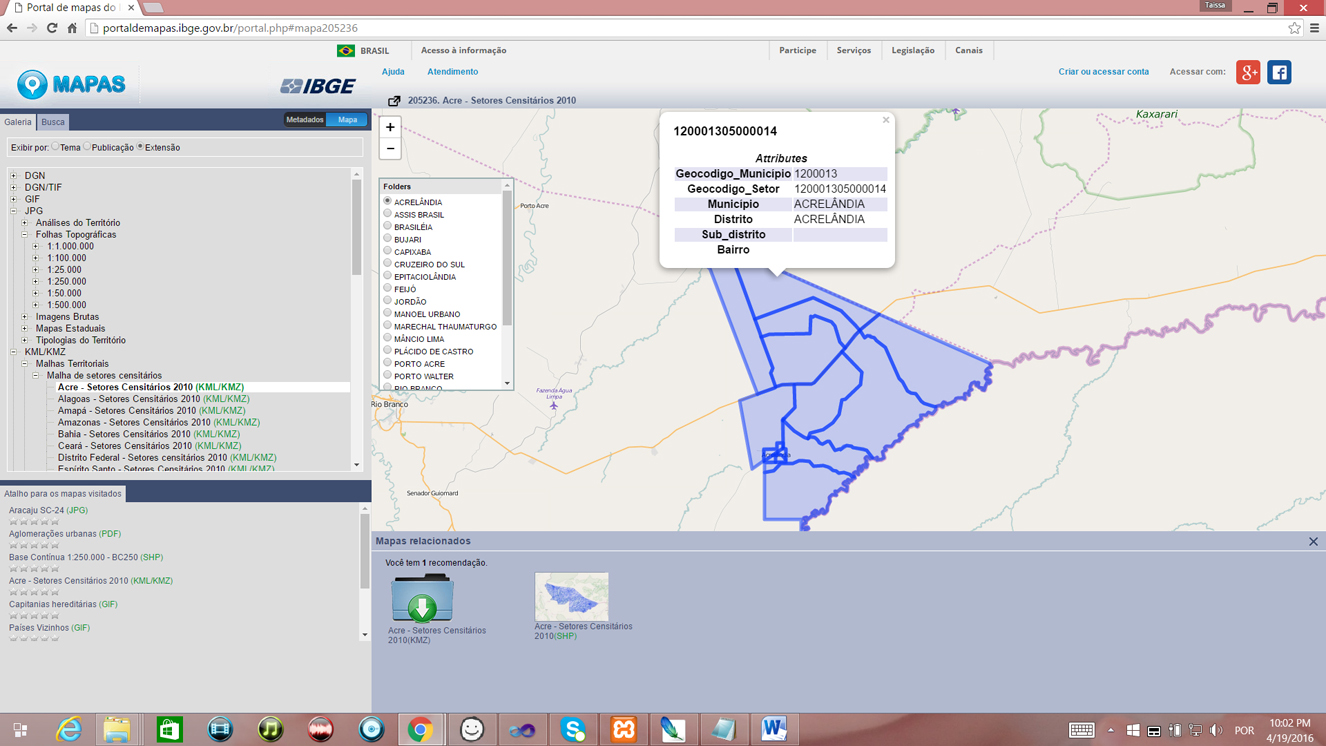
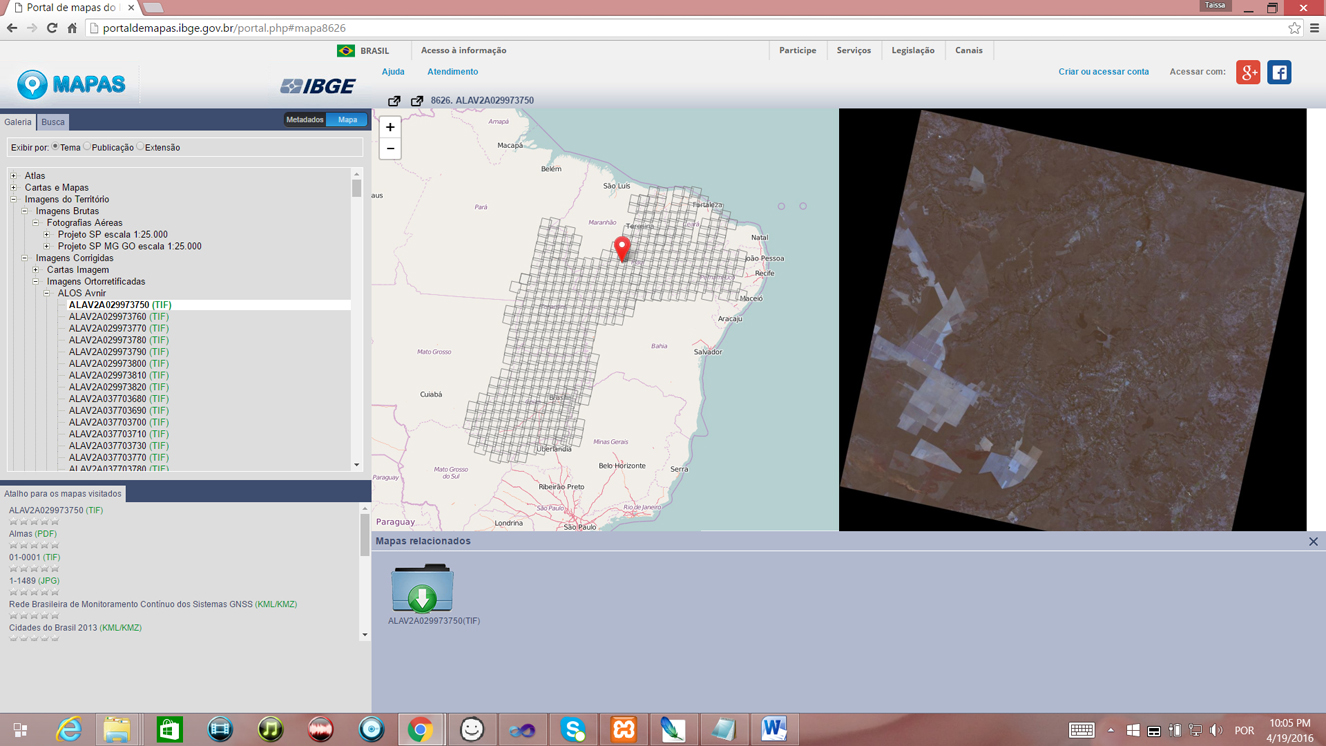
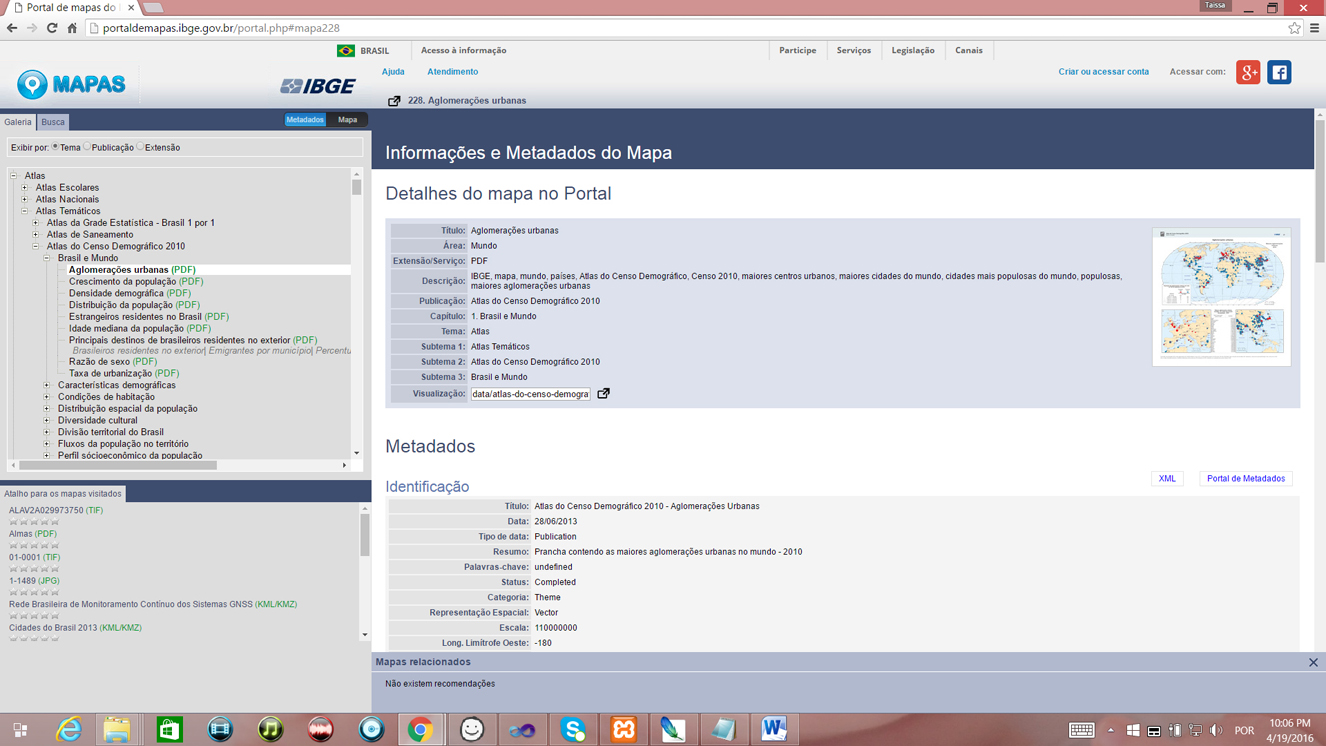
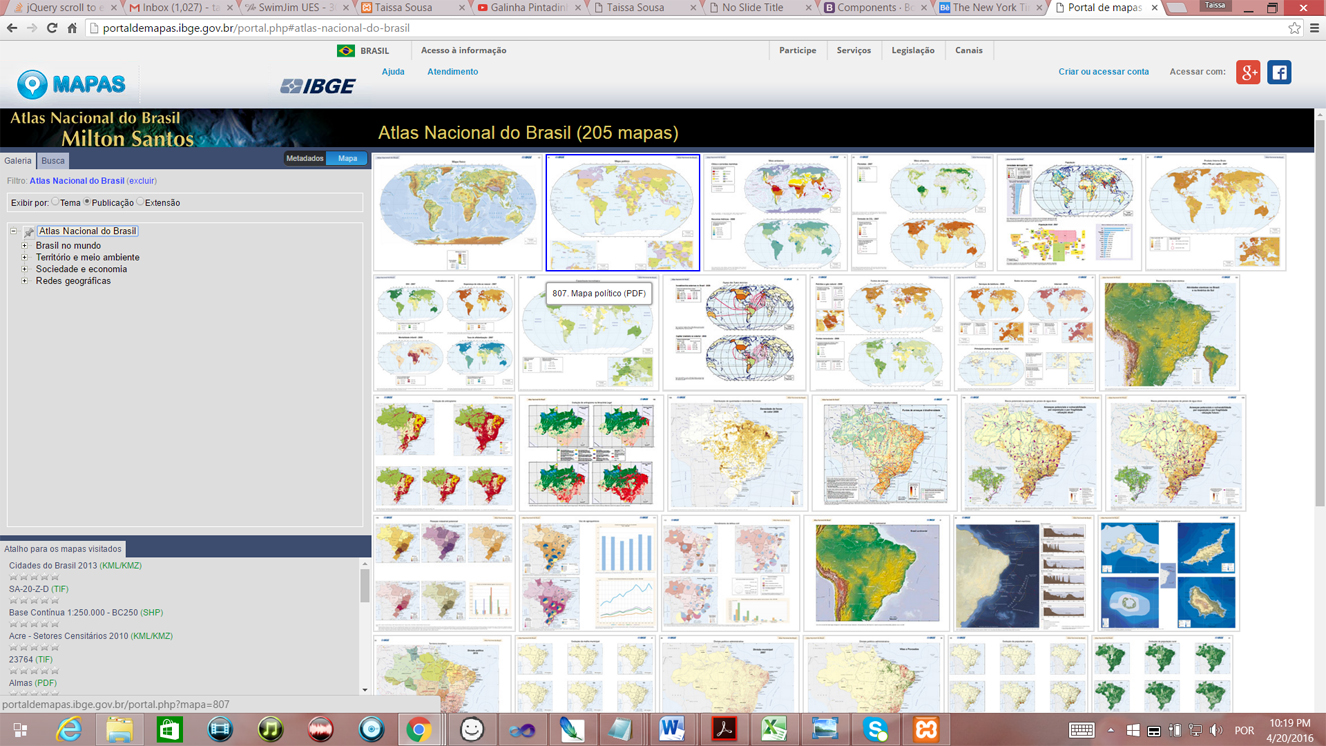
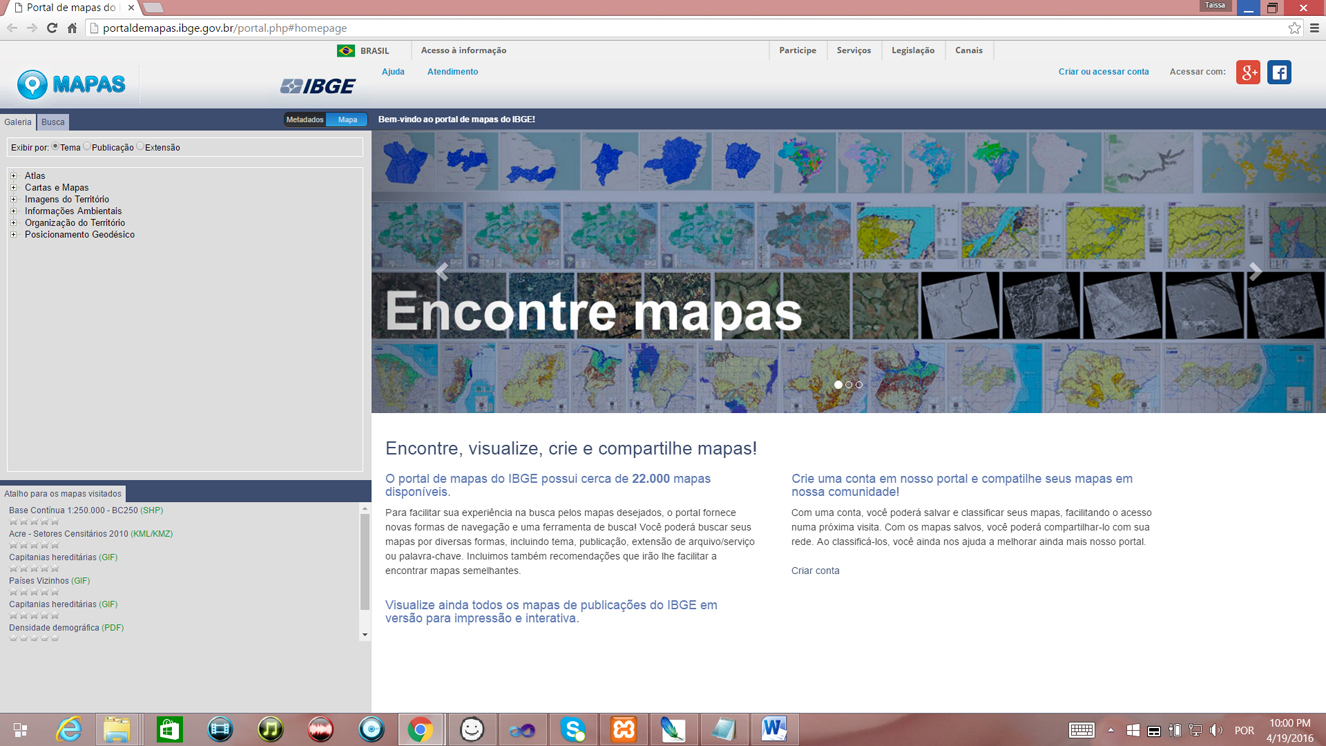
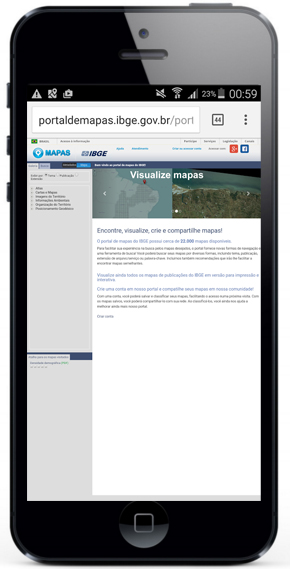
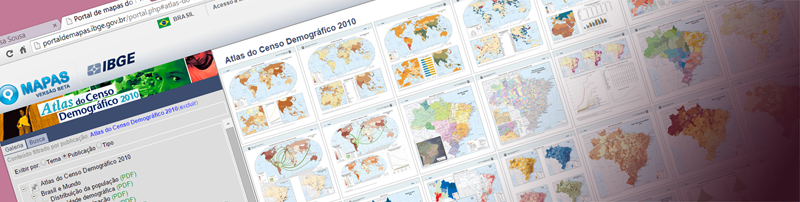
Find, Visualize, Create and Share maps:
the IBGE's Portal of Maps
Available at: http://portaldemapas.ibge.gov.br
Duties: Project Management, UI/UX, Data Visualization, Information architeture, Front-end and Back-end development
Concepts & Methods: Scrum, Recommender Systems, Web Semantic, Geographic information system, Usability evaluation
Tools & Tech: Balsamiq, Leaflet, Google Maps API, Javascript, Jquery, CSS, HTML, PHP, Mysql
View presentation