
View presentation
 Next
Next
 Next
Next
Taissa A. F. de Sousa
Interaction & Visualization Designer, M.Sc. in Computer Science
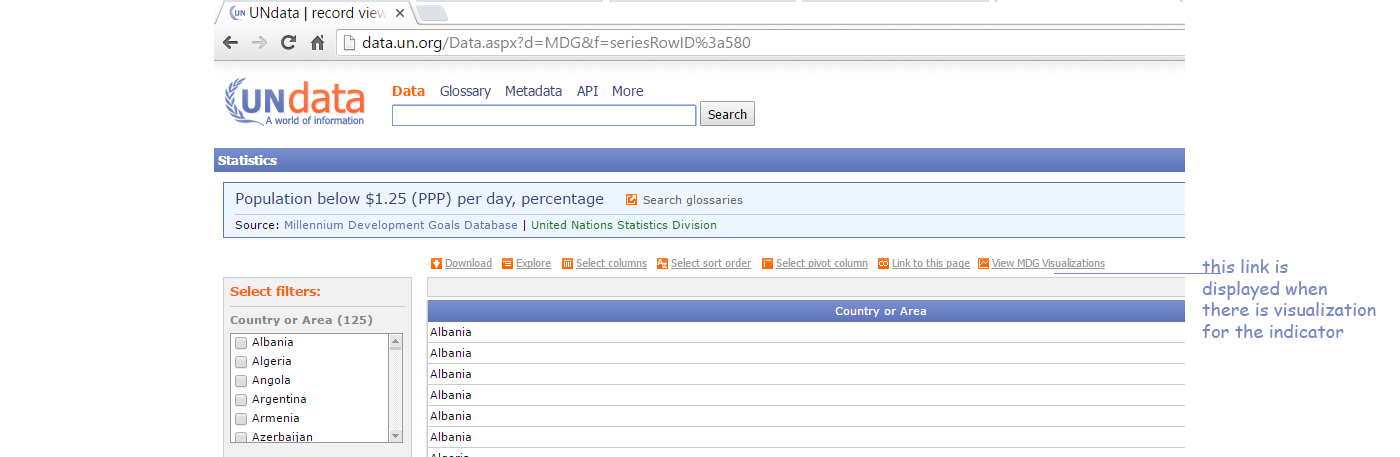
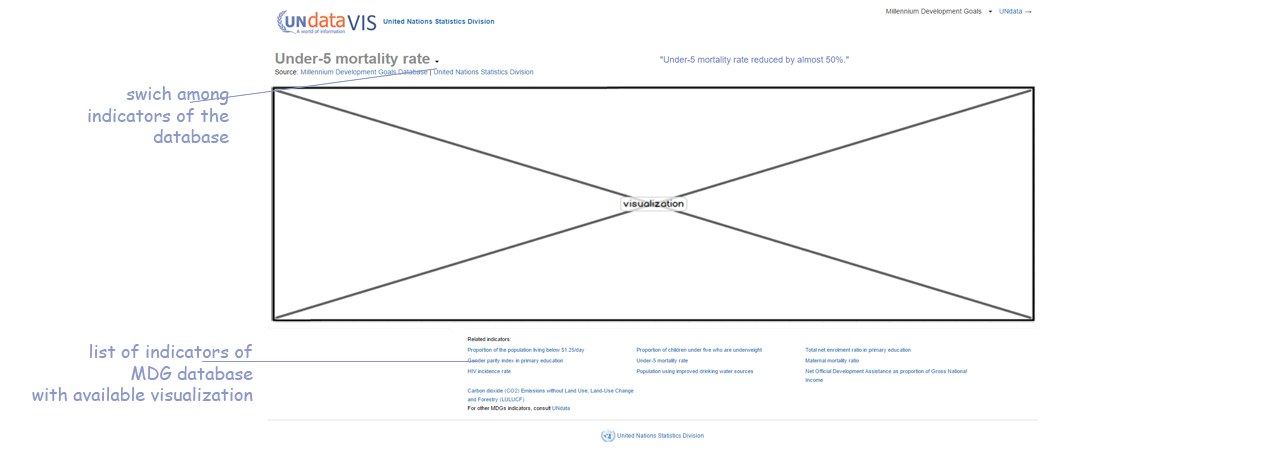
Visualizations for the Millennium Development Goals
Available at: http://data.un.org/undatavisualizations/
Duties: UI/UX, Data Visualization, Front-end and Back-end development
Concepts & Methods: Storytelling, Motion Graphics, Human computer-Interaction, Interactive visualization
Tools & Tech: Google chart tools, Javascript, Jquery, CSS, HTML, C#, .NET, MVC, SDMX, XSLT
View presentation
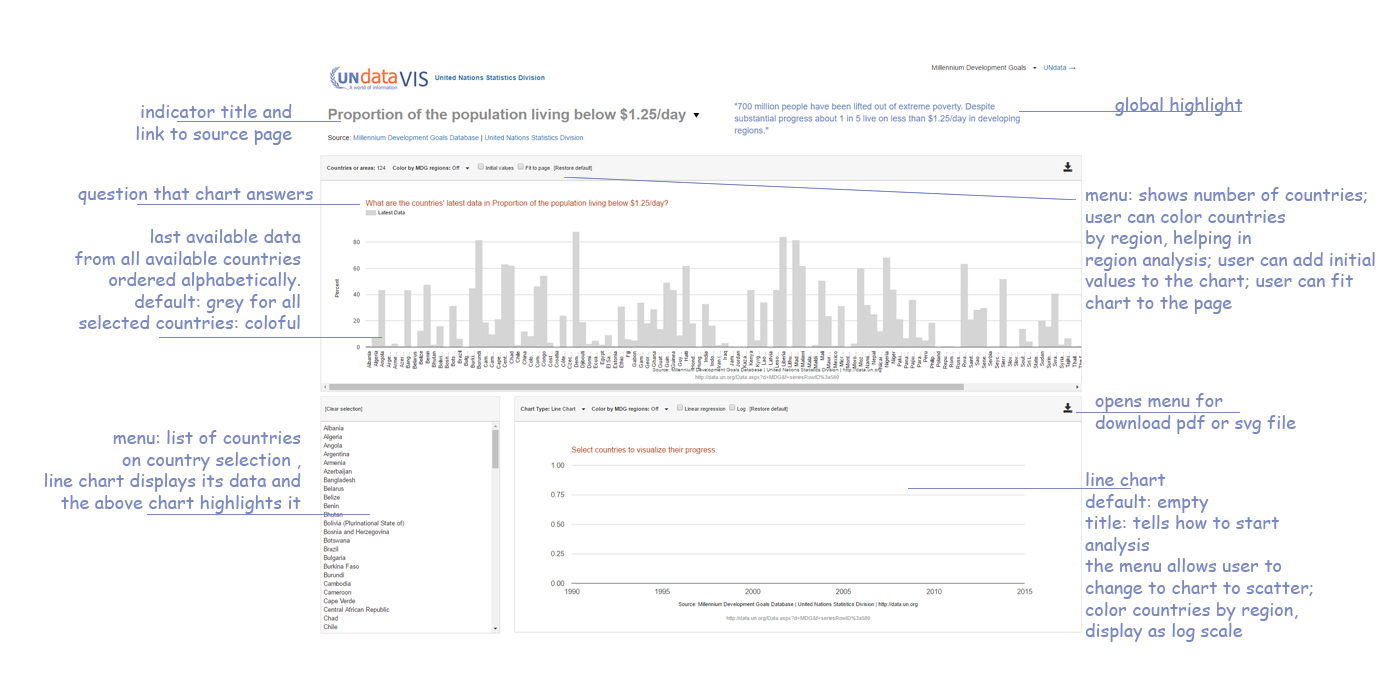
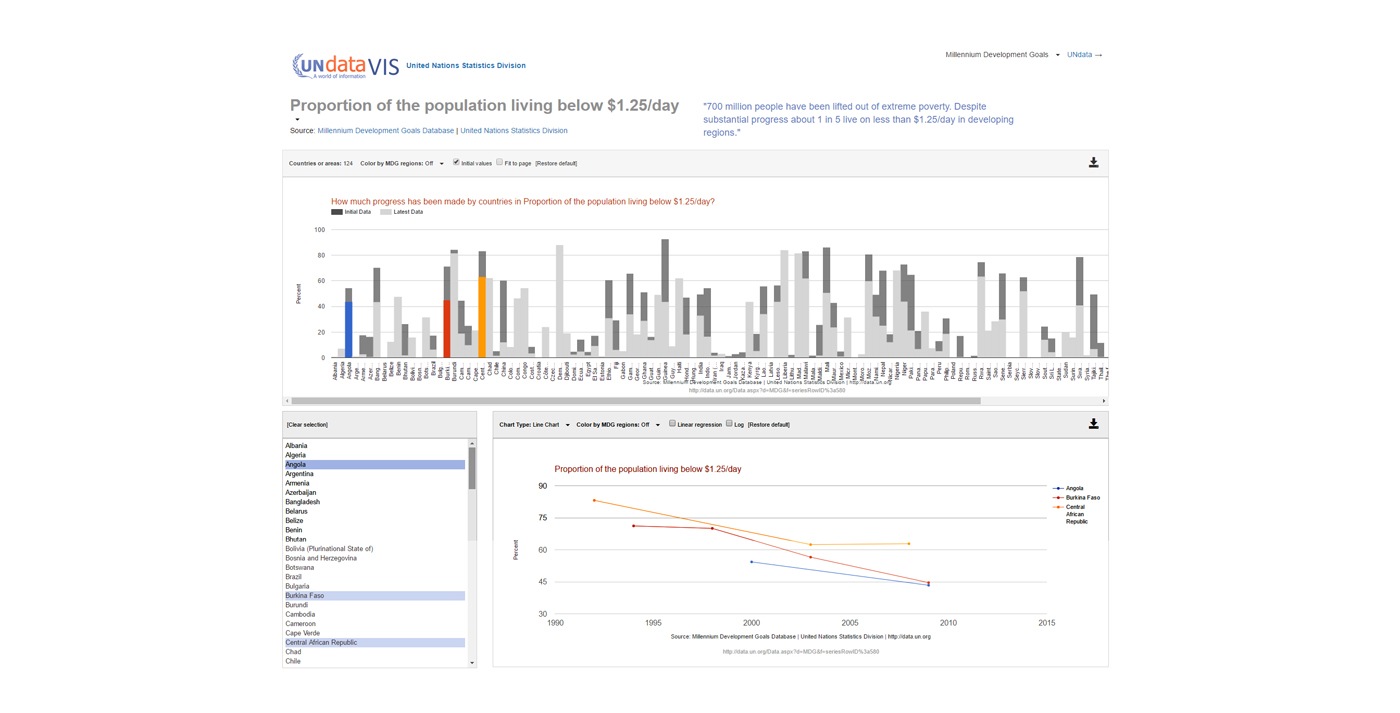
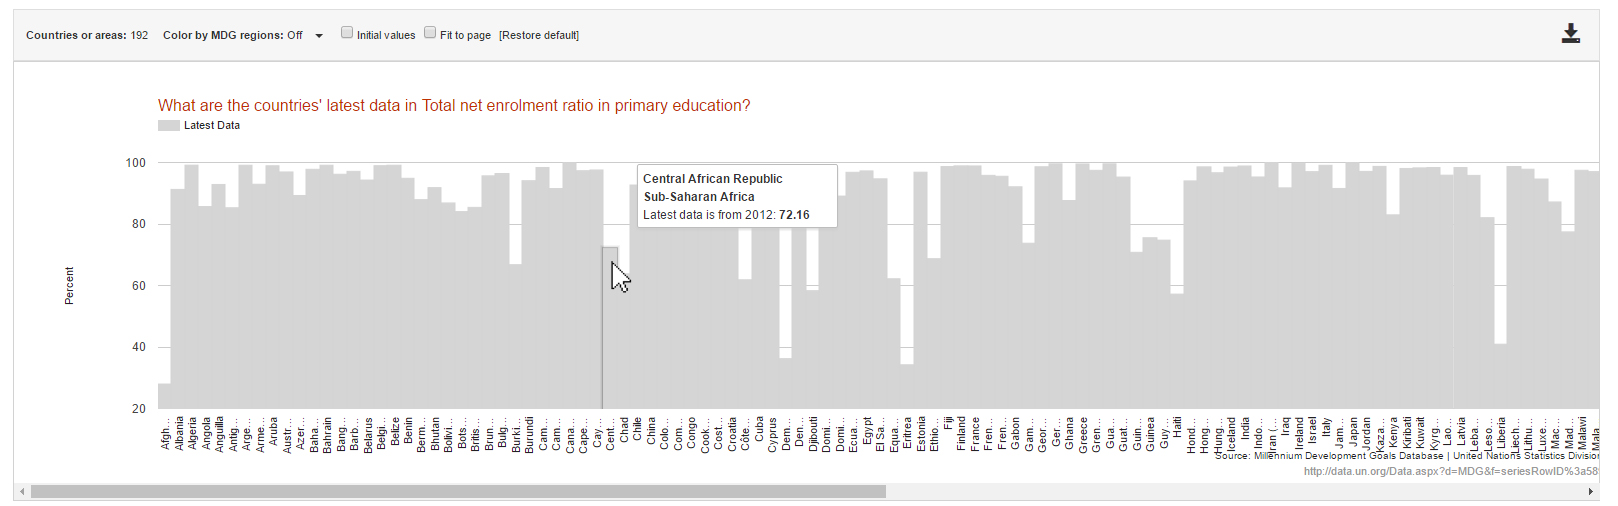
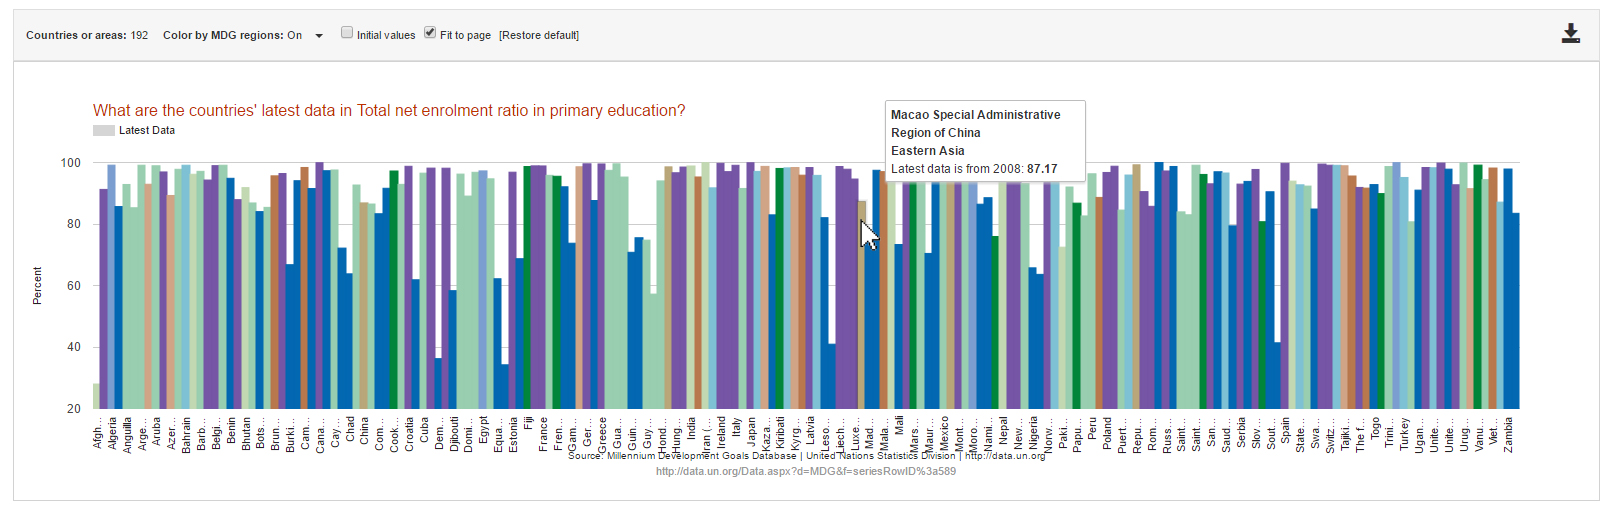
What are the countries' latest data in ... ?
Fit to page: off; Colors displayed by MDG region: off
Fit to page: on; Colors displayed by MDG region: on
Next
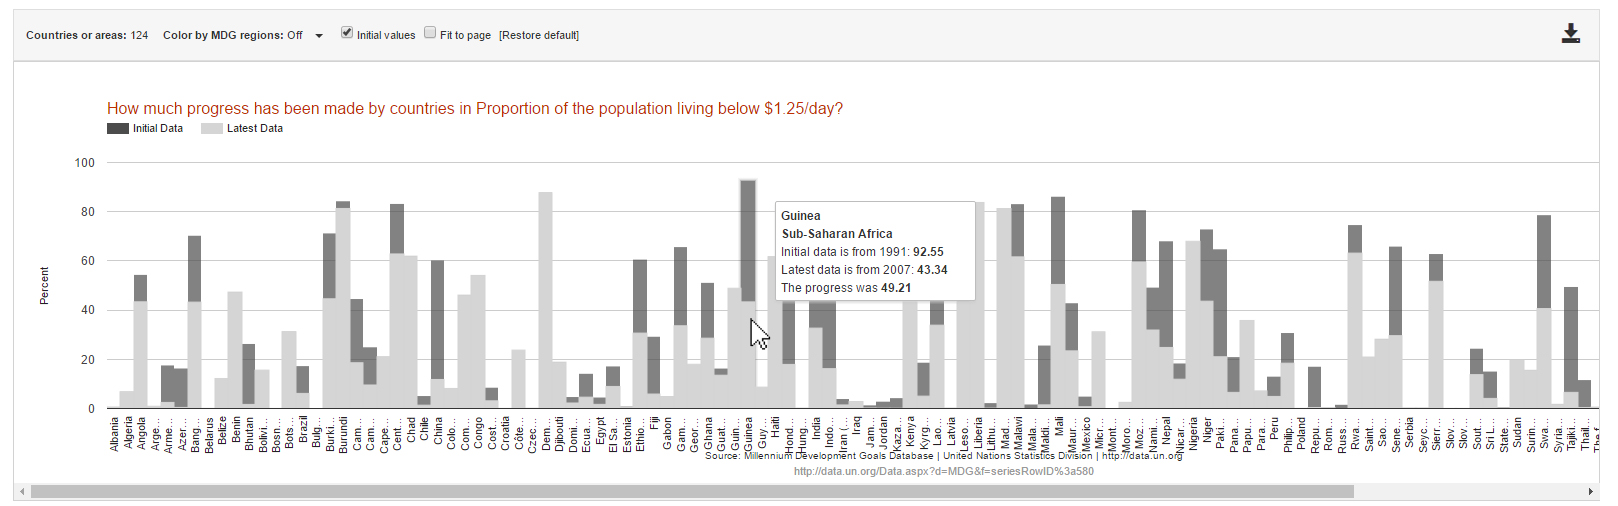
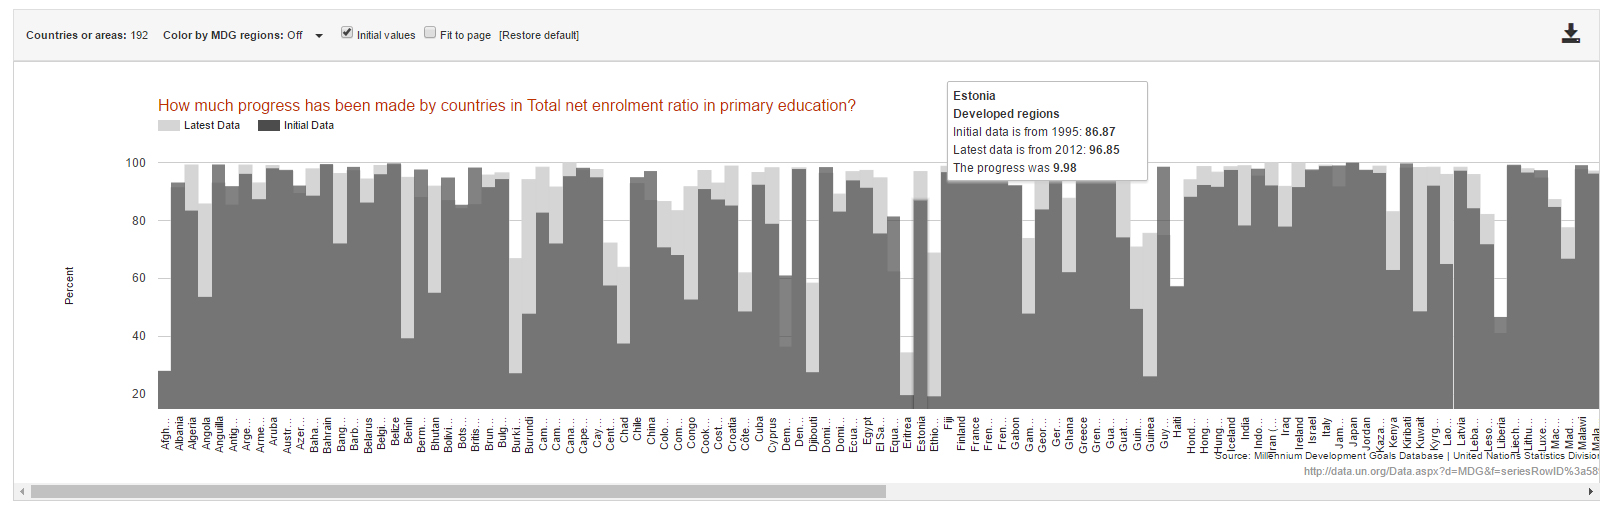
How much progess has been made by countries in ... ?
Indicator with descendant progress
Indicator with ascendant progress
Next